Housing Price Predictor
Introduction
In this project, we are given a dataset with 79 features in which the end goal is to predict the sales price of various houses. All of the features and their descriptions can be found on the link here. The main challenges with this dataset are: missing data, outliers and feature selection.
The code for this project can be found here.
Exploratory Data Analysis
The first step to any data science project is to take a look at the data. Are their missing values in the data? Is the data clean or noisy? Are their outliers in the data? What is the distribution of our dataset? Which features should we choose for our predictive model? Answering these questions will give us a better idea of how to tackle this problem.
The first question we are going to try and answer is a matter of feature selection. Which features are actually useful for determining house price? To do this we look at the correlation matrix. The correlation matrix pretty much tells you if there is a linear pattern between the house price and the target feature.
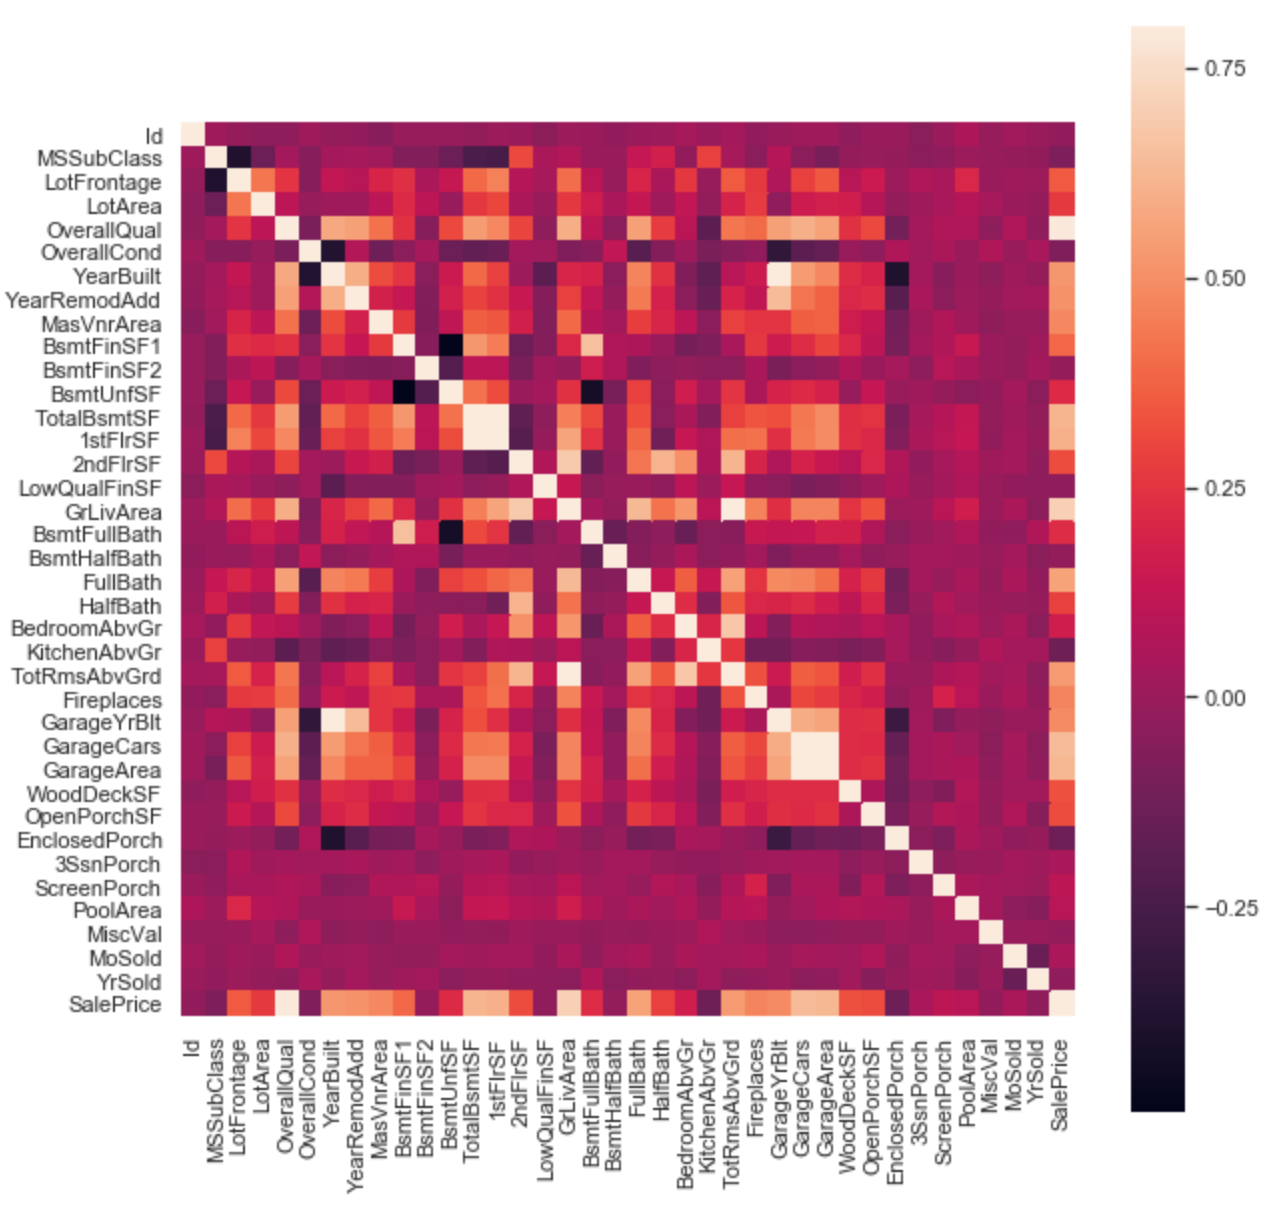
Alright, so from the correlation matrix shown above, we can see that the top 5 features with a strong linear correlation with sales price are:
- OverallQual (Overall Quality of the house, ranked from 0-10)
- GrLivArea (Above ground living area, measured in square feet)
- GarageCars (How many cars can the garage fit)
- GarageArea (Size of garage, measured in square feet)
- TotalBsmtSF (Total square feet of the basement area)
Let’s examine these features more closely and look at their distribution. Ideally, we would like to see a gaussian distribution for these features so that we can use some statistical tricks such as least-squares fitting. Certain machine learning algorithms, like linear regression, fit the data by assuming that the error between prediction and actual follow a gaussian distribution. Meanwhile, algorithms like support vector machines and decision trees do not make such assumptions.

Looking at the histograms above, we can see that most of the features have a right skewness. Moreover, “GarageCars” and “OverallQual” are non-continuous features that have integer only values. We can make the data more normally distributed by applying a simple log transformation, of course this is an optional step that may or may not improve the performance of our predictive model, but it is worth a try.
Now that we have a good understanding of the distribution of the features, we can check for non-linear correlations and outliers by using a scatter plots.
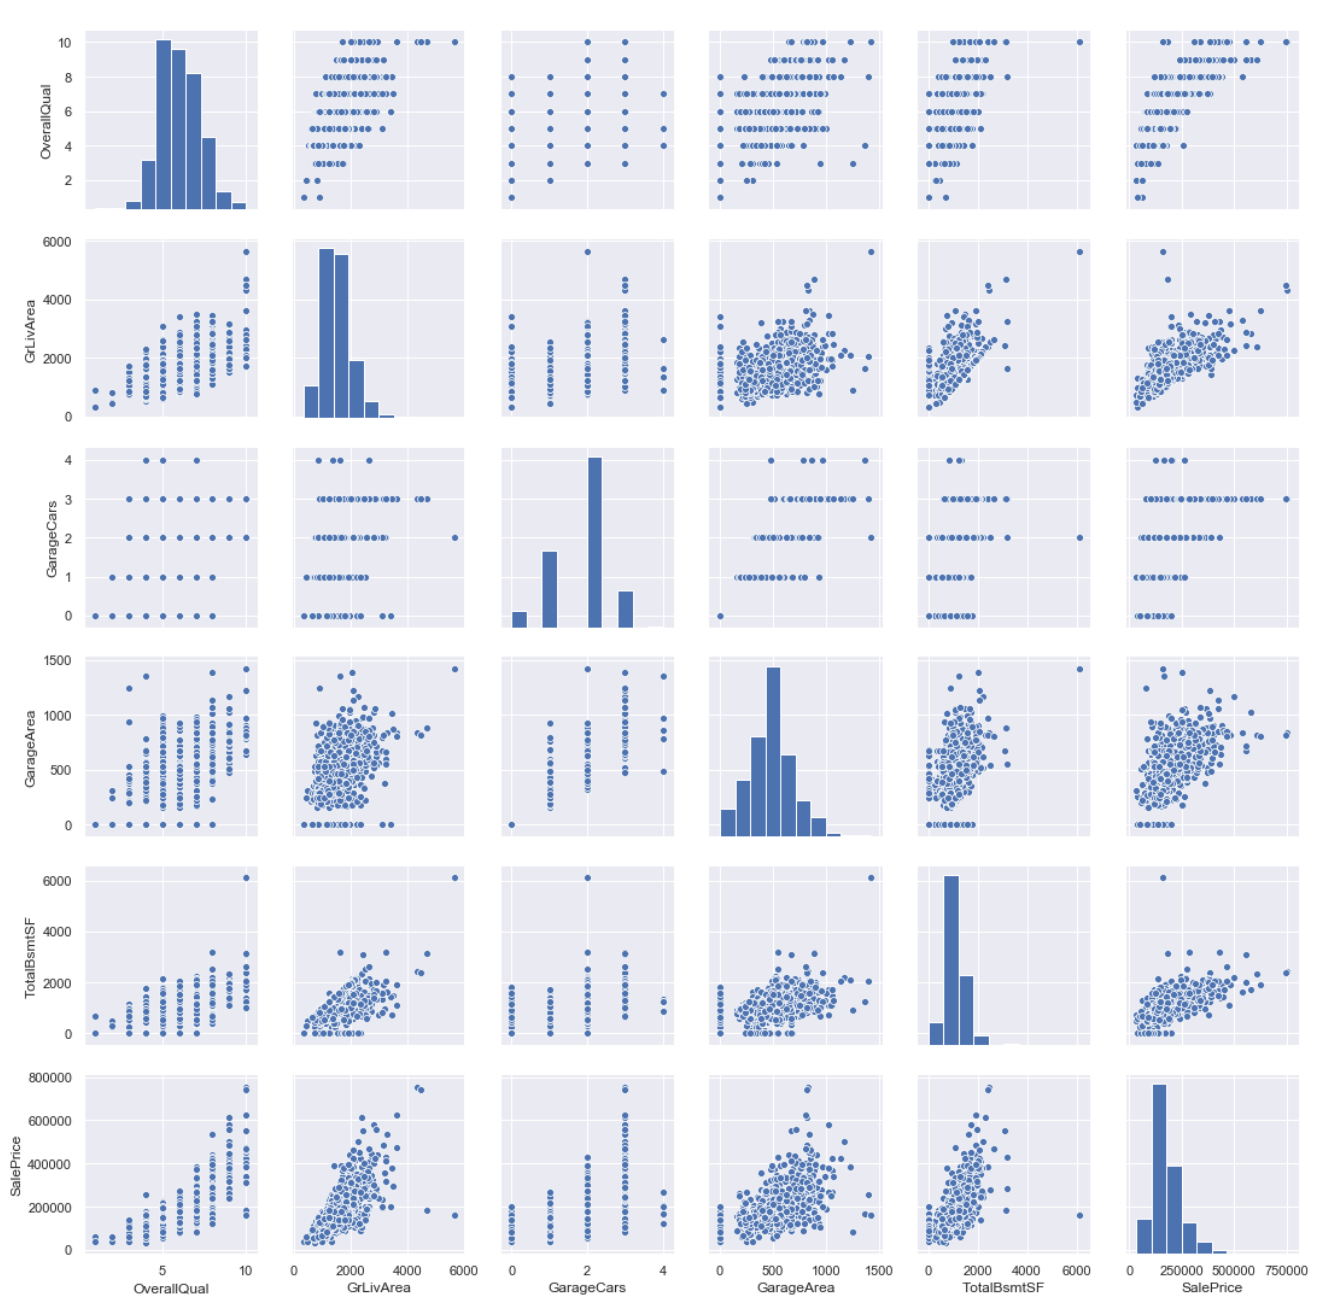
Couple things that we can see from looking at these graphs are:
- GrLivArea, GarageArea and TotalBsmtSF seem to have a lot of values which are 0. This could simply be because the house is missing these things. This must be the datasets way of stating “N/A” since not all houses have basements or garages.
Predictive Modelling
Now, let’s move on to the fun part. Here we will try many different machine learning algorithms to see which performs best at predicting housing price. Since there is not a lot in terms of visuals to show in this section, I encourage you all to check out the code here.